1

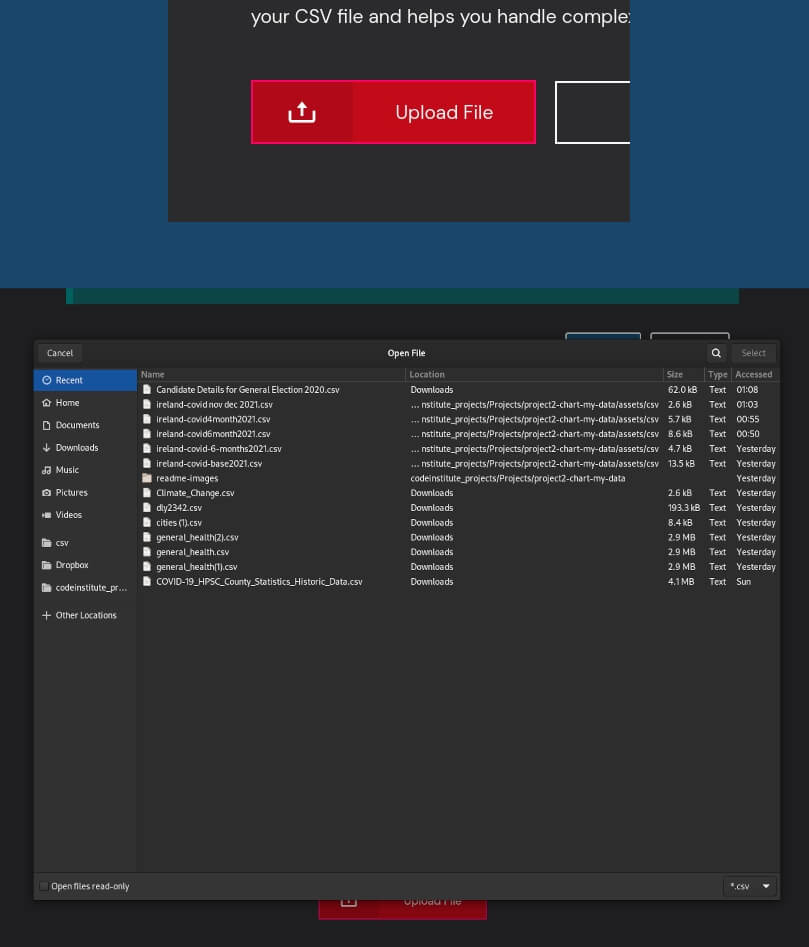
Preparing your CSV file for upload

Please prepare your file for easy uploading and to minimize errors.
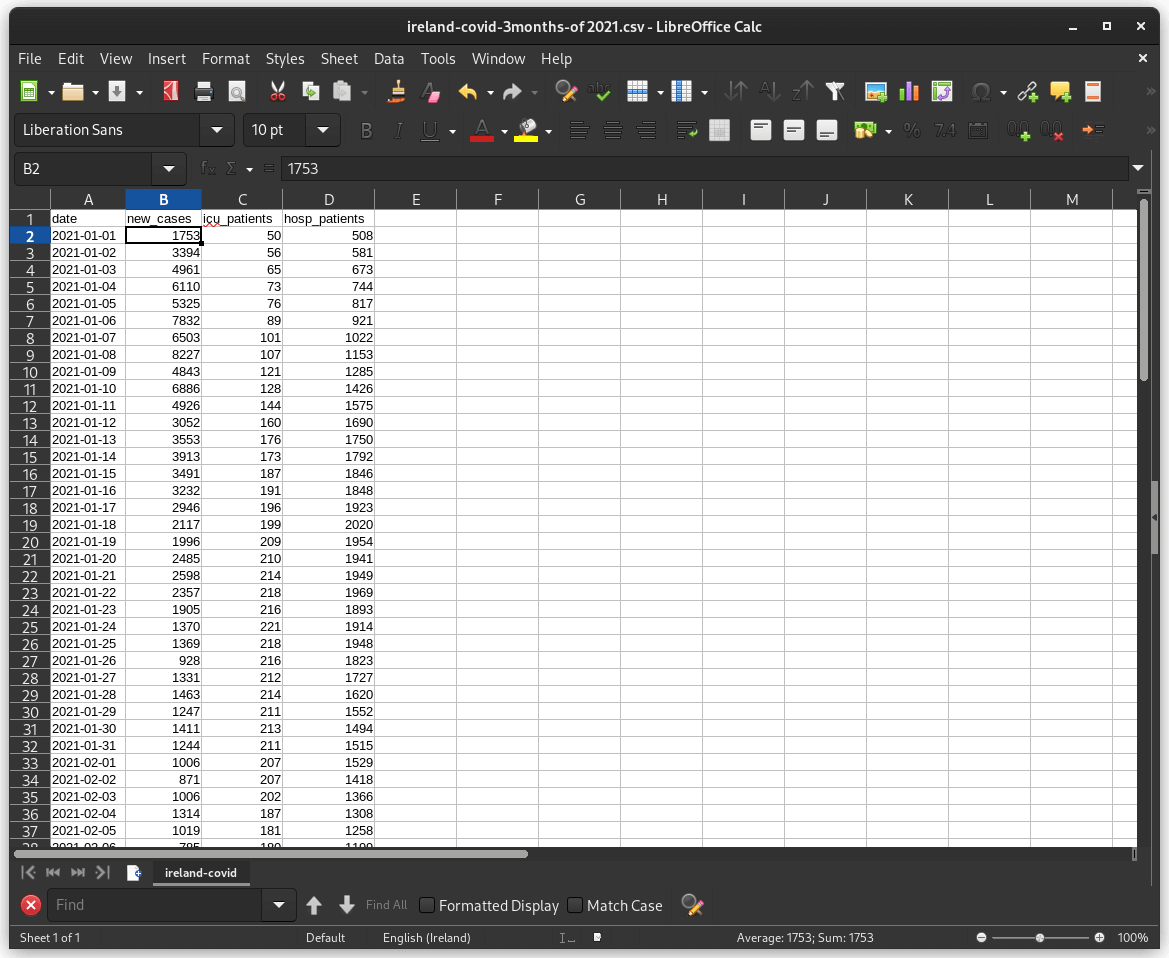
Limit the file to the data you wish to see, with the names across the top and the timeline or dates down the left hand side.
Spreadsheet software can edit your CSV file.

two images of a line and bar chart overlapping in a cascading manner
2

Uploading your CSV

Click on the button to upload CSV file and your file browser will open prompting you to select a file, by default the browser will only look for CSV files.

two images of a line and bar chart overlapping in a cascading manner

once the file is uploaded you can view and interact with the chart

Changing from bar chart to line chart will reset the buttons to viewing all the datasets.
There is a upload button underneath the chart to upload another file, (this will replace the current file).

3

Chart type

Chose which type of chart that best suits your need, as some charts work better for particular types of data.

two images of a line and bar chart overlapping in a cascading manner
4

Hover - tool tip

You can hover over the bar or line chart to view the exact coordinate on the chart, (x and y, and the related color).

two images of a line and bar chart overlapping in a cascading manner
5

Unselecting data

By default the chart loads all the data and names and propagates buttons below the chart. You can toggle them on and of depending on what data you wish to view.

two images of a line and bar chart overlapping in a cascading manner